Information Spaces, Referat im Seminar "Next Generation Interfaces" ; Ralf Bähren, Mai 2003
THE INFORMATION VISUALIZER (1999) An Information
Workspace
Xerox Parc, Stuart K.Card, George G. Robertson, Jock D. Mackinlay

Verwandte Themen:
ABSTRACT: Der Information Visualizer ist eines der ersten und intensivsten Forschungsprojekte mit dem Ziel, das User-Interface den räumliche-kognitiven Fähigkeiten des Gehirns anzupassen. Das Projekt basiert auf Studien, die nachwiesen, dass räumliche Navigation sowie räumliche Erinnerung effektiver funktionieren, als die 2D-Darstellung bisheriger GUIs.
Ziele:
- Beschleunigung des Prozesses der Informationsaufnahme (= Retrieval
und Anzeige)
- Vergrößerung des Workspace, Erhöhung der Informationsdichte
- Delegieren von Aufgaben an Agenten => z.B. Suchprozesse
- Verschieben von Informationsaufnahme vom abstrahierenden Teil des menschlichen
Geistes zum
Wahrnehmungszentrum
- Echtzeit-Interaktion
The Information Visualization project has for many years been exploring the application of interactive graphics and animation technology to the problem of visualizing and making sense of larger information sets. This work is based on the premise that many complex information tasks can be simplified by offloading complex cognitive tasks onto the human perceptual system.
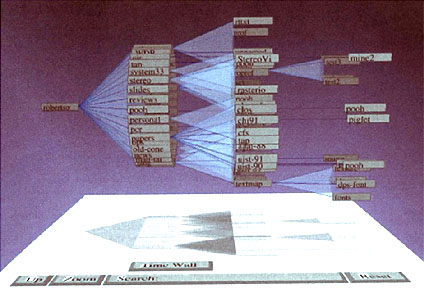
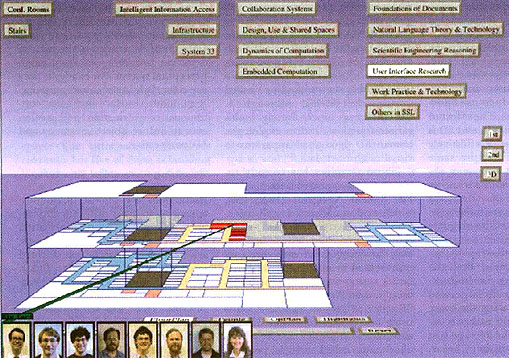
The Information Visualizer (IV) [Robertson et al.] is based on a 3D Rooms
metaphor to establish a large
workspace containing multiple task areas. In addition, other novel building
blocks were developed to support a new user interface paradigm. The IV
architecture has enabled the development of a set of animated information
visualizations for hierarchical information, including the Cone-Tree ,
the Perspective Wall and the Table Lens. The figure above shows examples
of a cone-tree and a perspective wall. Many of these techniques use the
display uniformly, assigning a large number of pixels to a focus area,
and retaining contextual cues in less detail. These techniques allow the
display of larger number of items than could previously be put on the
screen. For example, the top 600 nodes of the Xerox organization chart
could be seen all at the same time even though it otherwise requires an
80-page paper document.
Externe Links:
››
The Information Visualizer
detaillierter Seminarvortrag auf deutsch